TL;DR
Community analytics is the practice of connecting what members do, what they say and what happens next. A useful framework measures discovery, participation, response, repeat behavior, sentiment and business outcomes against a defined question. We recommend starting with the decision the team needs to make, documenting every metric, separating contributors from readers, comparing relevant cohorts and reading qualitative evidence alongside the numbers. A dashboard can describe activity. It becomes valuable only when it changes a product, community or customer decision.
A busy community can still be unhealthy. A quiet one can still be useful. Post counts alone cannot tell the difference.
We have seen teams collect every available metric and still struggle to answer the question that matters: is the community creating value for members and for the app? The solution is not a larger dashboard. It is a measurement model that connects activity to a purpose, adds context and gives someone a clear next action.
What is community analytics?
Community analytics is the process of collecting and interpreting data from an online or in-app community to understand participation, member experience, community health and business impact. It combines behavioral measures such as visits, posts, comments and repeat participation with qualitative evidence such as discussion themes, sentiment, questions and feature requests.
The combination matters. Numbers show the size and direction of a pattern. Conversations explain what may be driving it. The GOV.UK Service Manual recommends the same discipline for digital services: combine performance metrics with user research and draw on several data sources rather than relying on digital analytics alone.
Community analytics is broader than an engagement report. It should help a team decide what to investigate, improve, promote or stop.
Start with the decision, not the dashboard
Every measurement plan should begin with a written question. “How is the community doing?” is too broad. “Are new members finding a useful conversation in their first week?” is answerable.
| Decision question | Core measures | Context to add | Likely action |
|---|---|---|---|
| Are users discovering the community? | Entry-point views, visitors, discovery rate | Placement, campaign and app version | Improve visibility or onboarding |
| Are members receiving a response? | Response rate, time to first response, unanswered posts | Topic, member type and moderation status | Seed expertise or improve routing |
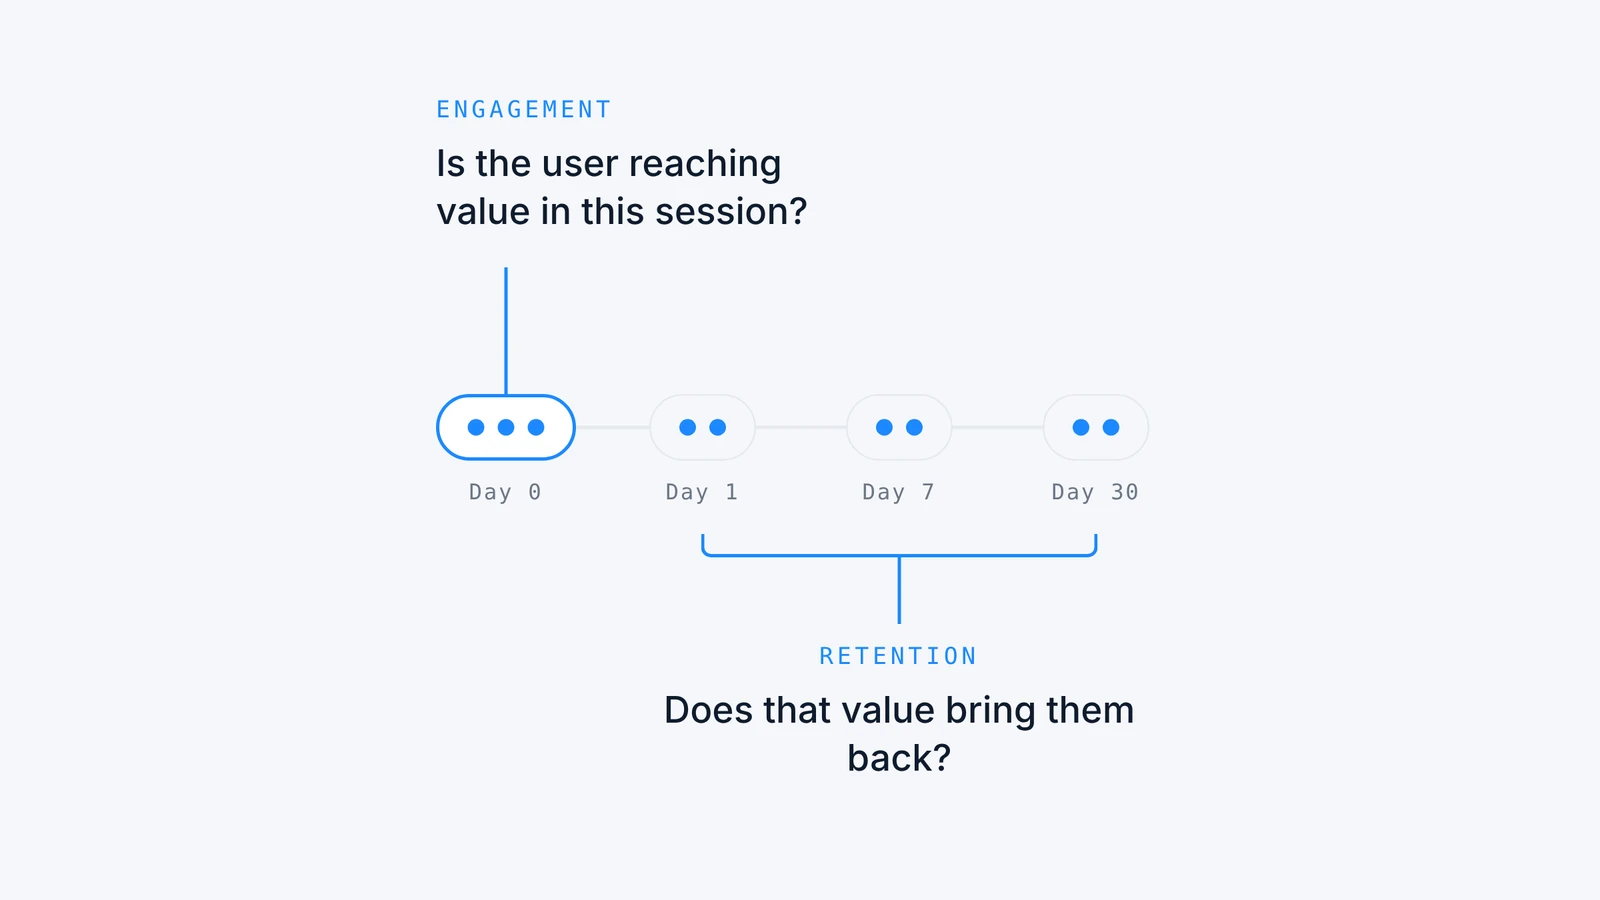
| Is participation becoming habitual? | Repeat visits, repeat contributions, cohort retention | New versus established members | Strengthen recurring formats |
| Which topics need attention? | Mentions, sentiment, reports and support signals | Release, segment, language and original comments | Investigate, communicate or fix |
| Does community support the app? | Feature adoption, sessions, retention or revenue | Control group and pre-defined window | Continue, change or stop the intervention |
This keeps the analytics proportional. If the decision concerns unanswered questions, a beautiful sentiment chart is a distraction. If the decision concerns product friction, total reactions will not settle it.
Measure the participation system
We organize community metrics around a sequence: discovery, consumption, contribution, response, return and outcome. Each stage can fail independently.
Separate readers from contributors
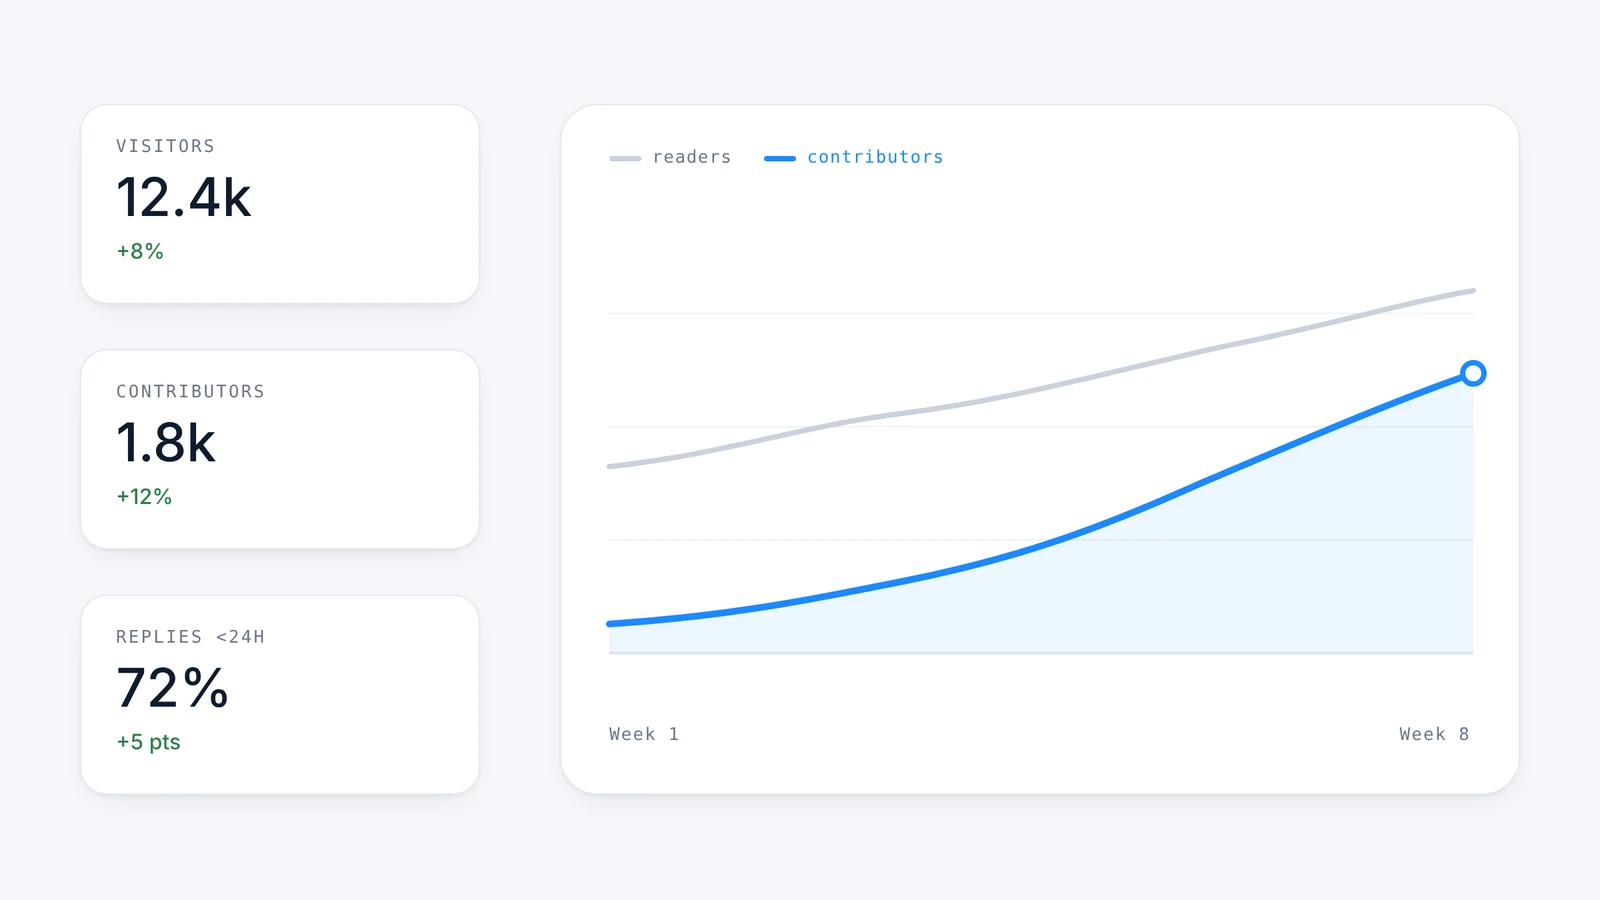
Members do not need to publish to receive value. Someone who reads an answer, follows a product update or votes in a poll may be participating meaningfully without writing a post. Report visitors, readers and contributors separately, then measure movement between them.
A falling contributor rate can signal weak prompts, poor discovery or fear of posting. It can also mean members are finding answers without asking another question. The surrounding evidence decides which interpretation is credible.
Measure depth and response quality
Ten useful replies can matter more than 500 low-effort reactions. For support or peer-learning communities, we care about response rate, time to first useful response, unanswered questions and whether the original member returns. For communities built around inspiration or entertainment, repeat viewing, sharing and topic follows may carry more weight.
Read trends and cohorts, not isolated snapshots
One launch week is not a trend. Compare the same metric over time and across cohorts that answer a real question: new and established members, contributors and readers, users with and without access, or members exposed to two different entry points. Record product releases, notification campaigns and incidents so an unusual spike has a plausible context.
Define every metric before anyone uses it
The label “active member” sounds precise until two teams calculate it differently. One may count a visit, another a reaction and a third a contribution. None is inherently wrong, but an undocumented definition makes comparison unreliable.
Google Analytics defines an engaged session through specific criteria involving time, a key event or multiple page or screen views. A community platform can use a different definition. Write down the event, time window, inclusion rules and denominator for every important metric.
We recommend maintaining a short measurement dictionary for active members, visitors, contributors, response rate, retention, sentiment and any business outcome. When the product or tracking changes, update the definition before comparing the new data with the old.
Connect community behavior to the main product
Community analytics becomes much more useful when identity and events can be connected to the app. A team can then ask whether members adopt a core feature, complete more valuable actions or return at a different rate.
The comparison still needs care. People who choose to participate may already be more motivated. A community-member cohort can reveal a pattern, but it does not prove that community caused the difference. When the business case depends on causality, use a controlled rollout, define the outcome and time horizon before launch, and keep guardrail metrics such as reports, notification opt-outs and support contacts.
This is the standard we apply to our own client evidence. We state whether a result came from a control group or from an observed comparison instead of adding a nervous disclaimer after every number.
Use sentiment to explain activity, not replace it
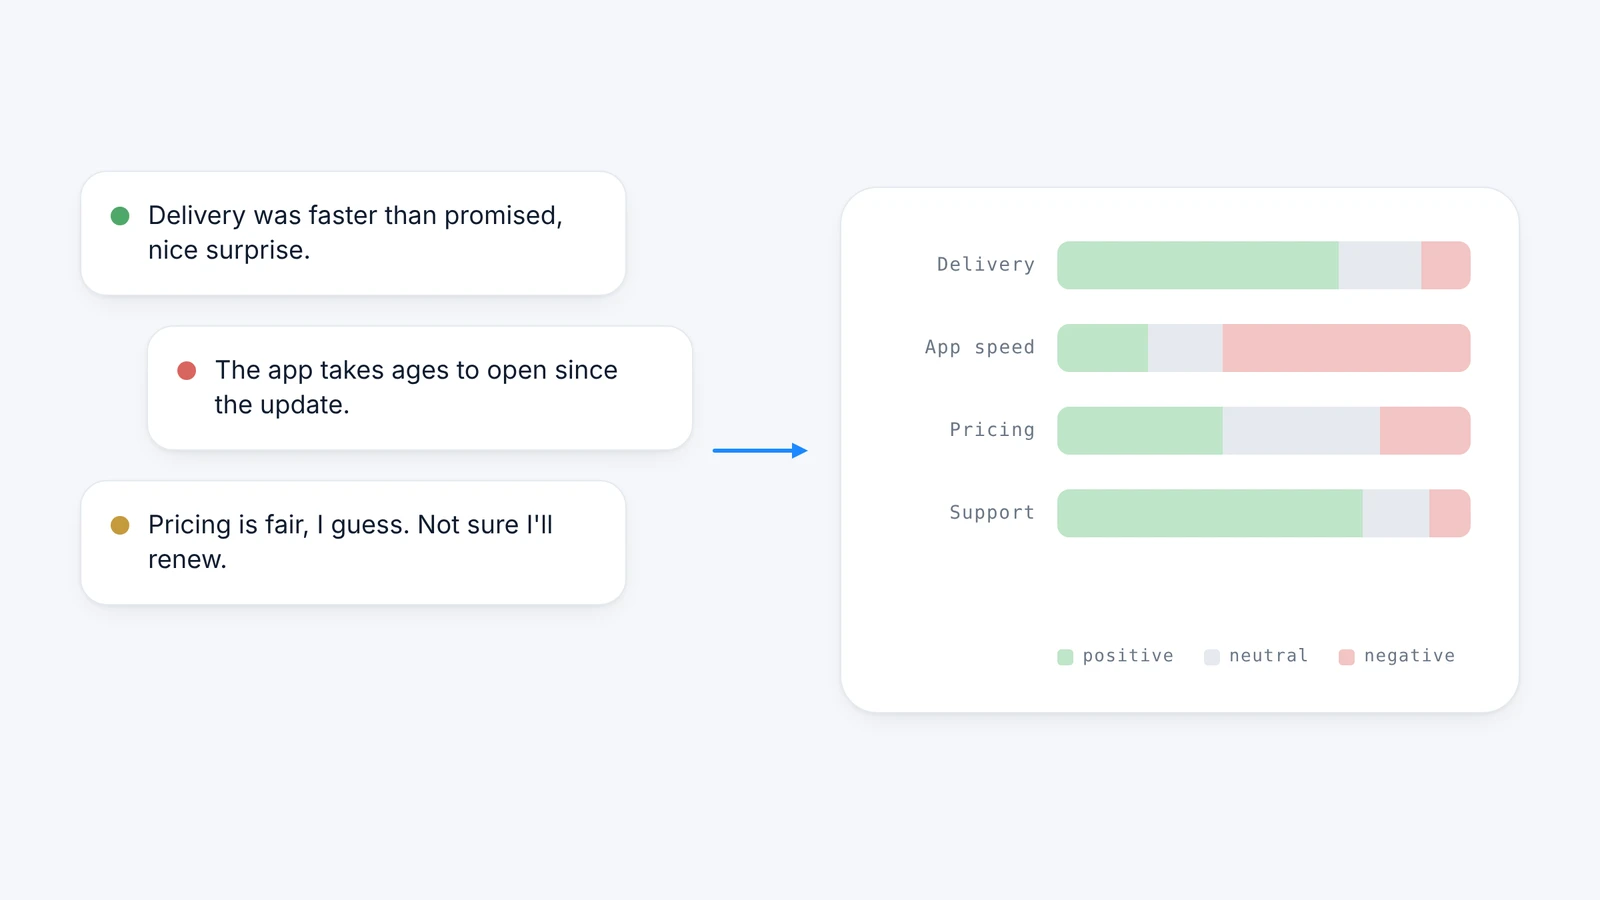
A discussion with 300 comments is active. The count cannot show whether members are enthusiastic, confused or angry. Sentiment and topic analysis add that missing layer by grouping what people are talking about and how the language is changing.
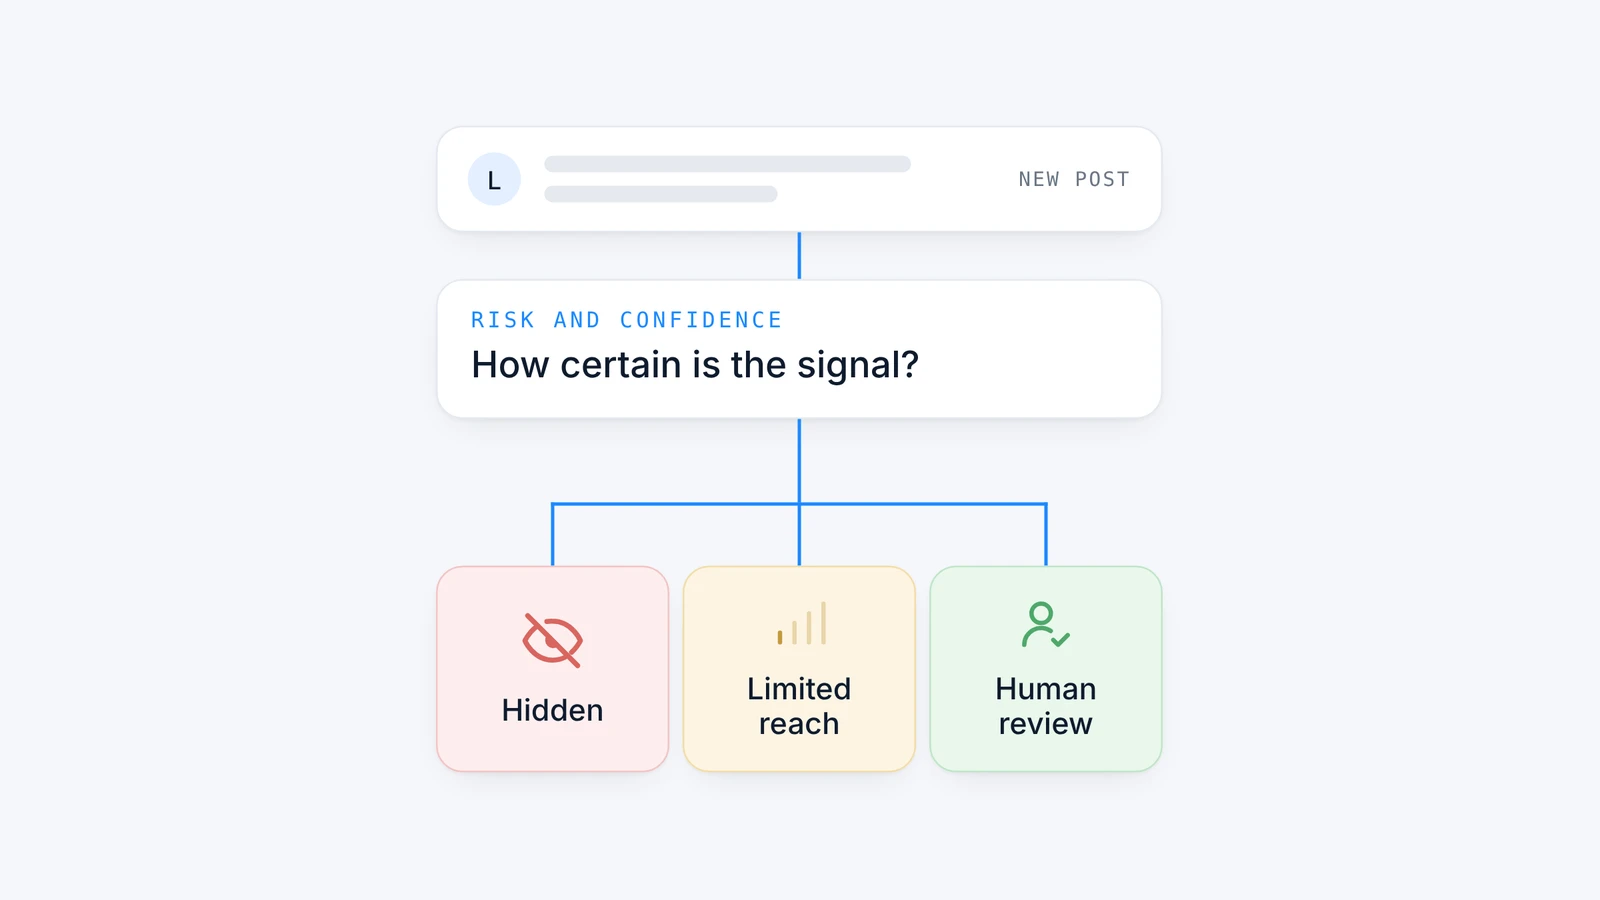
We recommend reading sentiment with volume, segment and representative comments. A sharp negative movement across eight posts is different from the same movement across 8,000. Sarcasm, mixed opinions and local language can also distort an automated score, so a person should be able to inspect the evidence behind the trend.
Our sentiment dashboard scores posts, polls and comments, clusters discussions into topics and rolls the signals into a live community score, a priority watchlist and a daily summary. That gives teams a starting point for investigation, not a substitute for judgment.
“Total members is the number teams love and the one that tells you the least. I look at whether new members get a reply in their first week. A dashboard alone can mislead: when a banking partner had an issue, Bankin' saw its community fill with questions. Counted as activity, it looked like a great week. Read as conversation, it was a support incident, solved with one pinned post.”
Grégoire Mercier, Co-founder and CEO, Octopus Community
Turn evidence into an operating rhythm
Analytics works best when every review has a cadence and an owner.
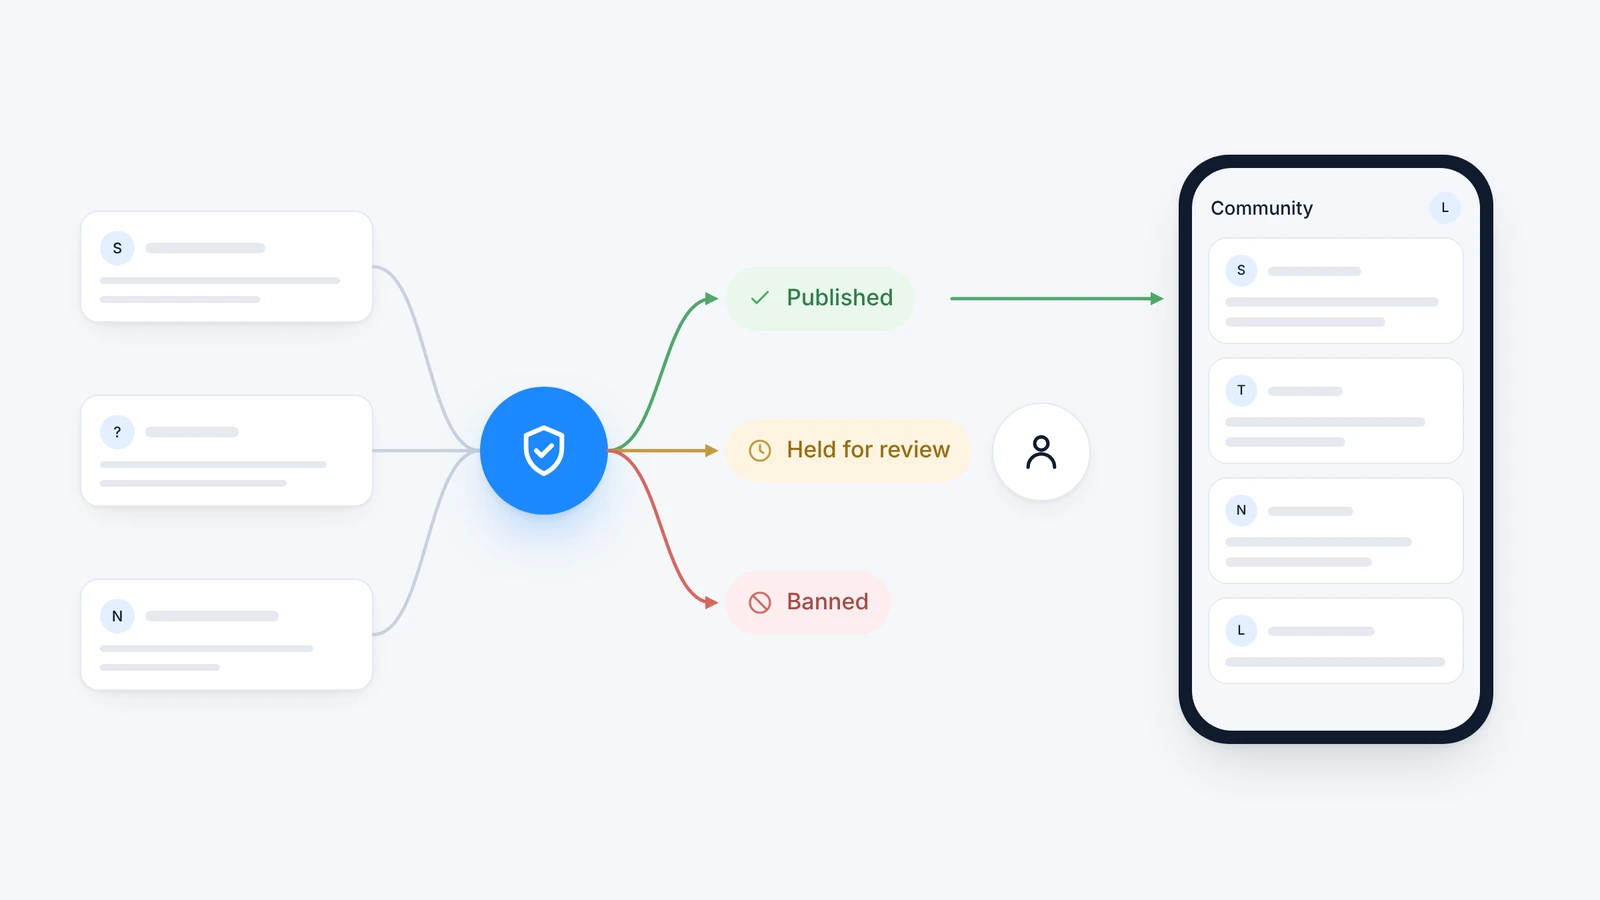
- Weekly: check discovery, unanswered posts, moderation signals, emerging topics and unusual changes that need a quick response.
- Monthly: review participation cohorts, repeat behavior, sentiment by topic, content formats and movement into the main product.
- Quarterly: assess the business hypothesis, measurement quality and whether the community design still supports the product strategy.
End each review with a decision, an owner and a date. That may be a product experiment, a new group, a changed notification, a support article, a moderation rule or a decision to collect better evidence. “Keep watching” is sometimes valid, but it should be a deliberate choice rather than the default ending of every meeting.
What our client data looks like in practice
Hotspot Shield used community polls to collect almost 10,000 responses on product-interface and usage questions. The useful part was not simply the response count. The team gained a large first-party evidence set tied to a known product question, then could read it alongside community behavior and customer comments.
Hellowork measures discovery, return, poll participation and core-product behavior. After five months, 25% of its user base visited the community monthly, 60% of visitors returned, and members applied for jobs 50% more often than non-members. The last comparison is an association, not a controlled causal result. It is still useful because it points the product team toward a business-relevant hypothesis to test.
The lesson is consistent: community activity becomes evidence when it is connected to a defined product question.
Make the dashboard answer a real question
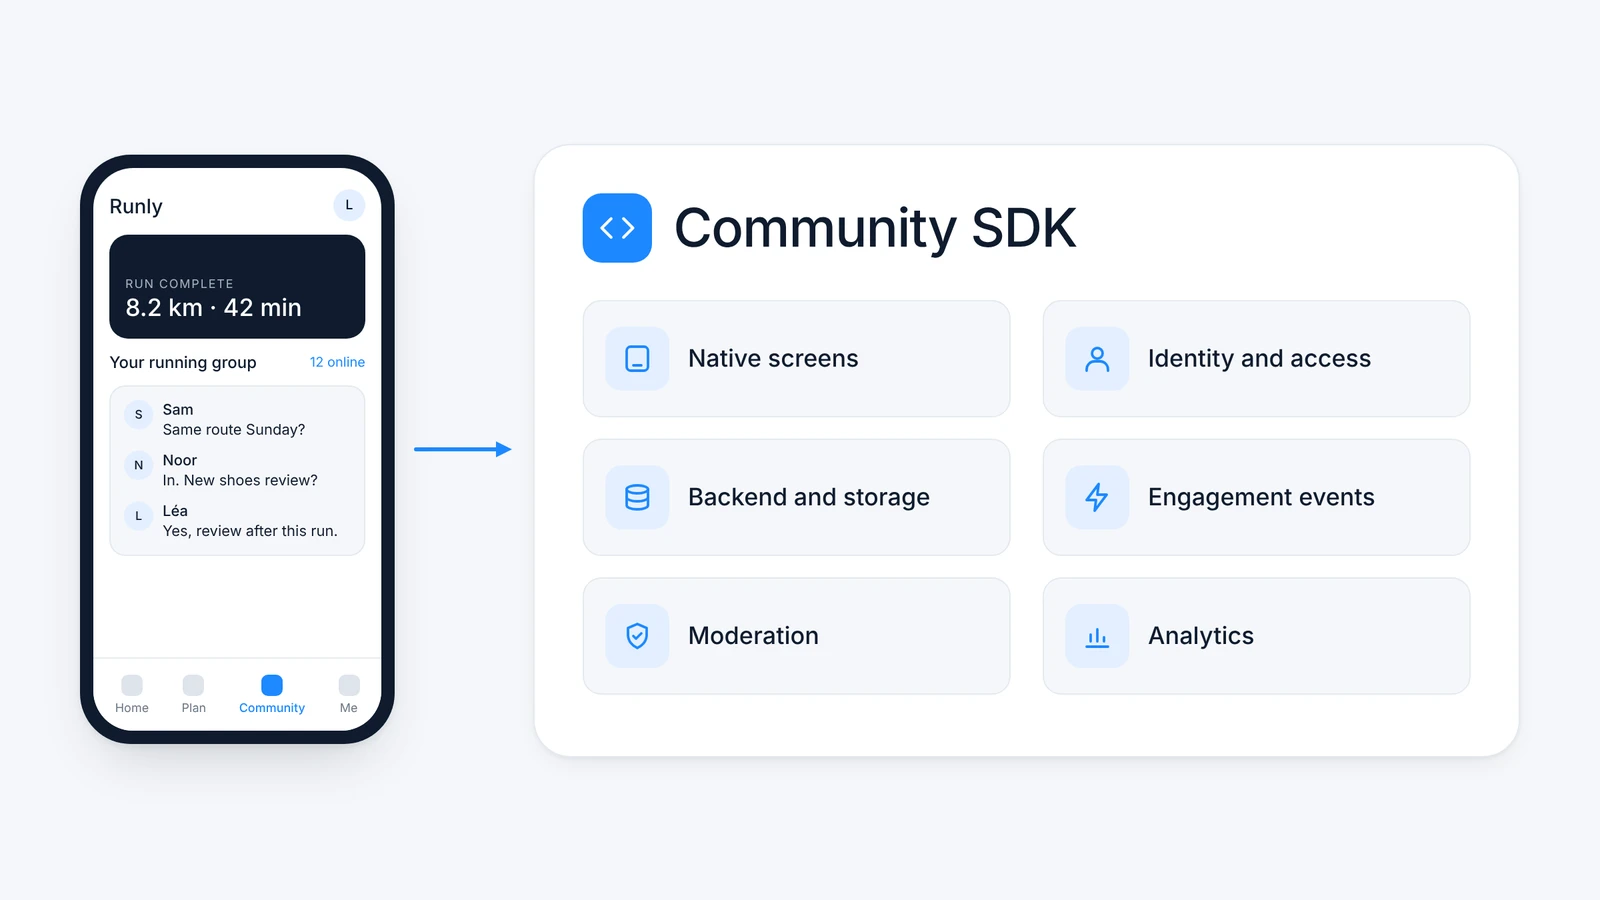
Octopus combines engagement events, participation data, polls, topic clustering and sentiment inside the app where the conversations happen. Explore how Octopus turns first-party community activity into product insight or book a demo to review the measurement model for your app.
Frequently asked questions
Which community metrics should we track first?
Start with discovery, active members, contributors, response rate, repeat participation and one outcome tied to the community's purpose. Add sentiment, content and lifecycle measures only when they answer a defined decision question. A smaller, documented set is more useful than every metric the platform exposes.
How do we measure community health?
Measure whether the community is useful, safe and sustainable. That usually requires participation, response quality, repeat behavior, sentiment, moderation signals and progress toward the product or business purpose. No single community health score should hide the measures beneath it.
What is the difference between an active member and a contributor?
An active member has completed the activity defined for the reporting period, which may include viewing or interacting. A contributor creates a post, comment, reply or another defined piece of content. Document both definitions because platforms and teams use these labels differently.
How can we measure members who mostly read?
Track community visits, post views, topic follows, poll votes, repeat reading and movement from community content into relevant product journeys. Passive consumption can deliver value, but it should be measured separately from contribution so the two behaviors are not confused.
How do we prove that community affects retention or revenue?
Use a controlled rollout where feasible, define the primary outcome and time window before launch, and compare the whole exposed cohort with a control. If only observational data is available, report the association honestly and test alternative explanations such as self-selection.
How often should community analytics be reviewed?
Review operational signals weekly, participation and topic trends monthly, and the broader business hypothesis quarterly. Urgent safety or support signals should bypass the normal cadence and reach an owner immediately.